
Animating the vibrations
Now we are ready to look at the output from the frequency, or vibrational analysis. We will be animating the vibrations and looking at the computed IR spectrum.
- open your optimised structure (without intermediate geometries!)
- From the main menu along the top of the screen (in gaussview) choose "Results" and then choose "Vibrations":
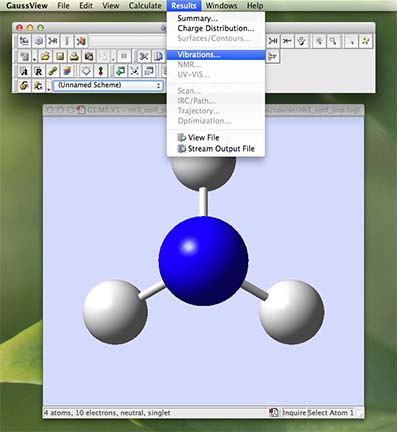
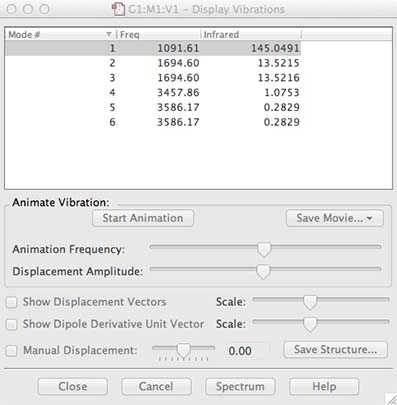
- a new window will open called "Display Vibrations":
- arrange your windows so that you can see both the molecule window and the vibration window
- in the molecule window rotate your molecule so it is not completely in the plane of the screen
- in the vibration window highlight the top vibration, then check the "Show Displacement Vectors" box, and finally click on the "Start" button, the molecule should start vibrating!
- look at all the vibrations by highlighting them one after another down the list
- All of these vibrations are active at zero kelvin! They represent the zero-point energy of the molecule, this is a purely quantum mechanical property of molecules.
- If you have any vibrations with a negative number under the frequency heading this means your molecule is not fully optimised, DO NOT repeat the calculation but ask a demonstrator to help you determine where you have gone wrong.
- Computational chemistry requires that you understand what has happened, you can waste a great deal of computer resource and your time by "repeating" calculations when you have no good idea of the error. Many students fall into this trap and it is important that we break this cycle before it starts.
- you should have 3N-6 vibrations. The "mode" number is meaningless it is just to list the frequencies. The number in the frequency column identifies the IR vibrational frequency of the mode, the infrared or IR column identifies the intensity of each vibration, both numbers are only accurate to an integer value.
- record all the vibrational modes in a table in your lab report. Take special attention to report all numbers to the correct number of significant figures.
- take a screenshot of the "Display Vibrations" window and include it in your lab report
- Vibrational modes are only observable (have intensity) in IR spectra if they involve a change in the dipole moment of the molecule. Computationally we seldom get an exact result due to numerical errors, any intensities under 1 can be considered to be forbidden or not observable in IR spectra.
- Answer the following questions in your lab report:
- how many modes do you expect from the 3N-6 rule?
- are any modes are formally forbidden ie not-observed?
- which modes are "bending" vibrations?
- which modes are "bond stretch" vibrations?
You have visualised the vibrations the molecule undergoes
- When you are ready close the vibration window move onto the next step