Animating the vibrations

Now we are ready to look at the output from the frequency, or vibrational analysis. We will be animating the vibrations and looking at the computed IR spectrum.

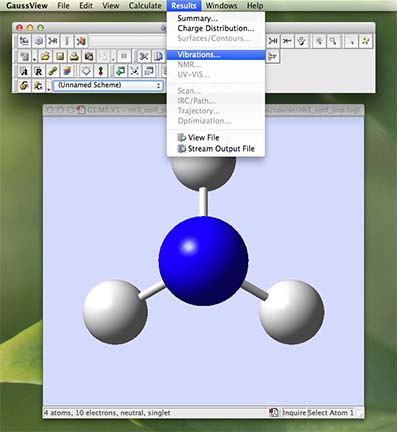
  • open your optimised structure (without intermediate geometries!)
  • From the main menu along the top of the screen (in gaussview) choose "Results" and then choose "Vibrations":

  • a new window will open called "Display Vibrations":

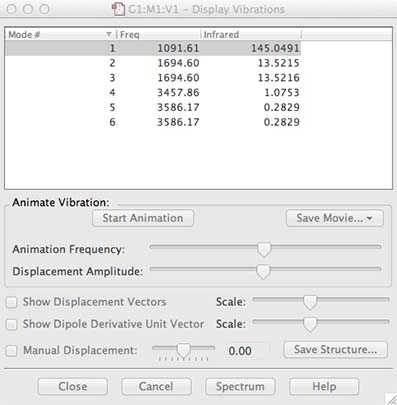
  • arrange your windows so that you can see both the molecule window and the vibration window
  • in the molecule window rotate your molecule so it is not completely in the plane of the screen
  • in the vibration window highlight the top vibration, then check the "Show Displacement Vectors" box, and finally click on the "Start" button, the molecule should start vibrating!
  • look at all the vibrations by highlighting them one after another down the list
  • All of these vibrations are active at zero kelvin! They represent the zero-point energy of the molecule, this is a purely quantum mechanical property of molecules.
  • If you have any vibrations with a negative number under the frequency heading this means your molecule is not fully optimised, go back and repeat the optimisation.
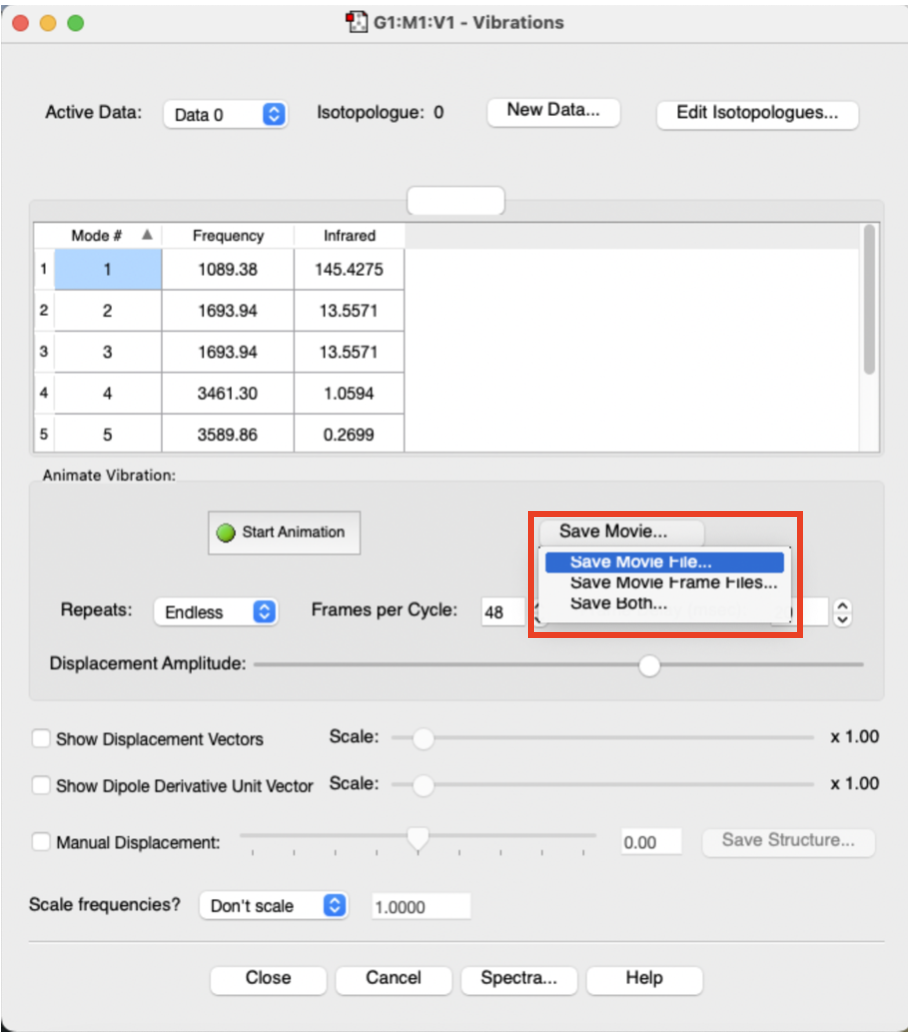
  • you should have 6 vibrations, with frequencies similar (but not necessarily identical) to my example. The "mode" number is meaningless it is just to list the frequencies. The number in the IR column identifies the intensity of each vibration.
  • the code is not "smart" it doesn't know to how many significant figures to report the results, so it just includes as many as it has. You as a human have to know how accurate the method and basis set you are employing are. In this case for B3LYP and 6-31G(d,p) both the wavenumbers and intensity are only accurate to integer values. It is very important when you report numbers from calculations that they are to the correct level of accuracy, and NOT simply the numbers the program spits out. The level you report the numbers to tells the reader how accurate they are!
  • now look inside your log file, here is part of my log file:
  •  Low frequencies ---  -11.5222  -11.4865   -0.0030    0.0245    0.1415   25.6160
     Low frequencies --- 1089.6618 1694.1735 1694.1738
     Diagonal vibrational polarizability:
            0.1276753       0.1276764       3.2989135
     Harmonic frequencies (cm**-1), IR intensities (KM/Mole), Raman scattering
     activities (A**4/AMU), depolarization ratios for plane and unpolarized
     incident light, reduced masses (AMU), force constants (mDyne/A),
     and normal coordinates:
                          1                      2              
                         A1                      E              
     Frequencies --   1089.6618              1694.1735          
     Red. masses --      1.1800                 1.0644          
     Frc consts  --      0.8255                 1.8001           
     IR Inten    --    145.4481                13.5571          
      Atom  AN      X      Y      Z        X      Y      Z      
         1   7     0.00   0.00   0.12    -0.07   0.00   0.00    
         2   1     0.00  -0.21  -0.53     0.76   0.00   0.00    
         3   1     0.18   0.11  -0.53     0.08  -0.39   0.22    
         4   1    -0.18   0.11  -0.53     0.08   0.39  -0.22 
    
  • The first line starting "Low frequencies --- " is very important, these values should be close to "zero"", where close means less than ±20cm-1. They are not exactly zero because the motion of the center of mass of the molecule is very hard to remove completely. There should be 6 "zero" frequencies for a non-linear molecule, ie the 3N-6 rule of IR vibrations.
  • When my students report their calculations to me they must include these two lines starting "Low frequencies --- " so that I know that the structure is really converged.
  • The log file shows the "numbers" that relate to the vibrations you have been visualising. See the Frequencies and the IR Inten lines in the output
  • If the symmetry of your molecule was the correct C3v you will see the right symmetry labels (A1 or E) for each vibration. The formatting in these files is primative and so does not include subscripts. If your symmetry was not C3v (and this can easily happen if you don't build your molecule carefully) you will see alternative labels. In this workshop we are not worrying about this aspect, but it is something you will need to address if you advance in computational chemistry.
  • This is easier than it looks, if the vibration is totally symmetric it must be A1, if it transforms into the negative of it's self under a σ plane it must be A2 and and if the vibration is degenerate it must be E. If you want to learn how to apply the correct symmetry (and re-optimise your structure) ask the demonstrator, but this is not required.
  • Now we are going to save an animation like that shown on the front page. Select the umbrella motion, view the animation and position the molecule so you can see the motion clearly, then stop any animated vibrations, and click on the "save movie" button, (ignore the error message that comes up) select save movie file (only!) Save the file (if you save it on your USB drive you can take the animated .gif away with you).
  • To view the animation, do not open the file with an image application, but drag the *.gif onto a browser (Firefox or Chrome) and you should see it doing its "umbrella" motion. The animation can be used in other social media.
  • gview_make_animated_gif ammonia_animated_gif

  • You have now visualised the vibrations that a real molecule undergoes

  • When you are ready close the vibration window move onto the next step