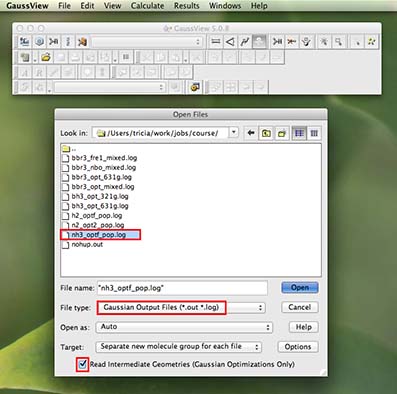
Now we can look at your finished job and understand a bit more about what is happening. From the main menu along the top of the screen (in gaussview) choose "file" and then "open" from the pull-down menu
a new window will open with available files. Before selecting a file it is important to first check that under
"File type" the pull-down menu has "Gaussian Output Files (*.out *.log) selected
the "Read Intermediate Geometries" tick-box is checked
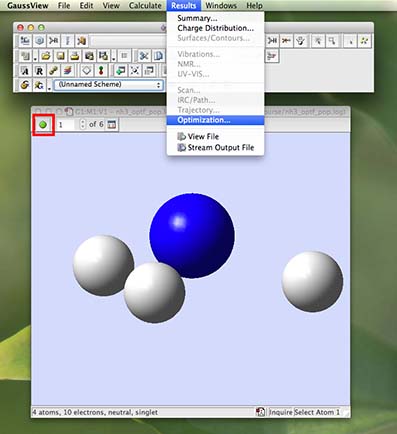
You should now have a molecule window open with your NH3 molecule in it. But your molecule has no bonds!!! Don't panic!
Look at the top left of the window, there should be a green button, click on the green button. Rotate the molecule a little so you can see what is happening to the structure more easily. The H-atoms of the molecule are moving in small steps towards the N-atom and forming bonds. The animation has only 5 steps so it recycles very quickly. Click on the same spot to stop the animation. You can click on the small arrows to step through each action of the optimisation movie and see this process more easily.
The first few structures don't have any bonds. Gaussview draws bonds based on a distance critera, so the fact that gaussview hasn't drawn bonds doesn't mean they are not there! Just that the distance exceeds some pre-defined value. important "Bonds" in gausview are a structural convenience. We set the N-H bond distance as 1.3 at the beginning, this exceeded the internally defined distance within gaussview.
From the main menu along the top of the screen (in gaussview) choose "results" and then "optimization" from the pull-down menu:
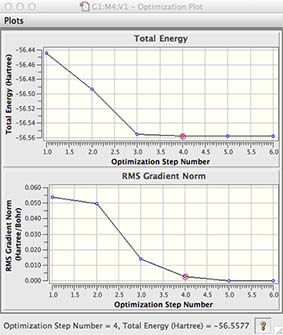
a new window will open, use the mouse to expand it, this window has a graph showing how the energy and gradient have changed over the optimisation, yours may look slightly different from mine!
the first graph gives the energy of your molecule at each step of the optimisation
the second graph gives the gradient or slope of the energy vs R (generalised coordinates) of your molecule at each step of the optimisation.
Remember we are looking for the lowest energy structure (top graph) and for the equilibrium structure with zero forces, or zero gradient (bottom graph).
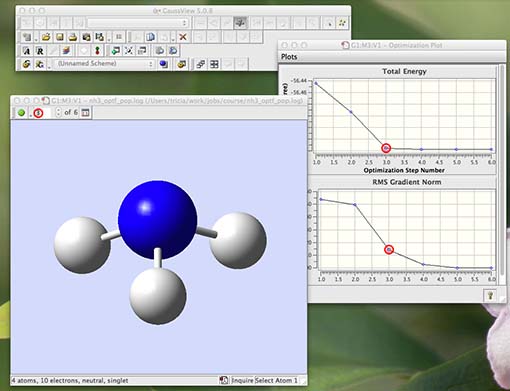
now step through the animation (using the green button or the arrows) you will see that each structure matches (red circles) with an energy and gradient. You are watching an optimisation in progress! Below I show step 3 of 6 in my optimisation:
The last structure has the most negative energy and the smallest gradient, this is the optimised structure of NH3.
Normally when you open an optimisation, only the final optimised structure is shown. However it is always a good idea to check the optimisation has completed properly once by opening the file and clicking the "read intermediate geometries" button and checking that the energy and gradient always go down.
Once you have checked the optimisation it is best to close the window, and then re-open the molecule without the intermediate geometries. I suggest this because students often forget that the first structure is not the optimised structure, and they analyse the wrong structure!
Now you have animated the molecule and visualised how it moves over the potential energy surface E(R)
When you are ready close the molecule window and move onto the next step