Now you need to confirm that you have a minimum energy structure, we do this by carrying out a frequency analysis, which also gives us the vibrational modes of the molecule.
To save time and effort we will also calculate the population analysis at the same time
If you can't remember the background to the analysis (why it identifies a minima) please go back and revise this from the first year lab.
Previously in the first lab you computed the optimisation and frequency analysis all in one job, this was because the NH3 molecule is very small and did not have complex issues like a high symmetry and unpaired spins to consider. It is good practice to always compute the optimisation in one job and the frequency and population analysis in a second separate job.
Open your final optimised 6-31G(d) structure (without intermediate geometries!)
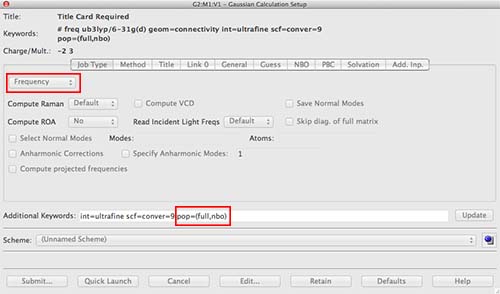
Click on the "method" tab to open it,
under job tab choose frequency
under the title tab type in something descriptive
add to the additional keywords "pop=(full,nbo)"
Give your job an appropriate name and submit it to run on the SCAN sever.
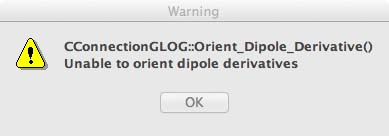
Open the *.log file, gaussview will very likely give an error message relating to the "dipole moment" of the complex, see the image below, just ignore this and click on OK. This is a problem with the gaussview software because of the high symmetry and zero dipole moment of the molecule.
From the main menu along the top of the screen (in gaussview) choose "Results" and then choose "Vibrations":
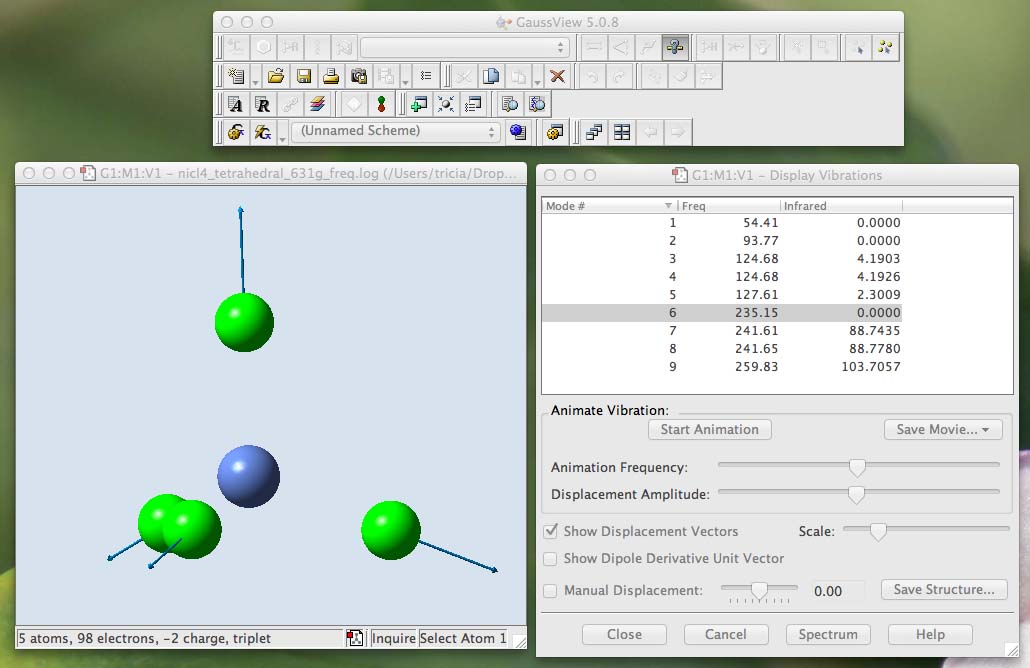
A new window will open called "Display Vibrations". The first thing to note is that there are no negative vibrations, you have a bona fide minima!
If you have any vibrations with a negative number under the "Freq" heading in the table this means your molecule is not fully optimised, go back and repeat the optimisation. If you are still unsuccessful after repeating your optimisation ONCE ask a demonstrator to help you determine where you have gone wrong.
Once you know your job is OK publish it to Dspace and record the unique DOI for submission as part of the lab.
The numbers under "Freq" give the wavenumber of the vibration, although these numbers are printed to 2 decimal places they are only accurate to the integer!
You may not have numbers identical to mine, but they should be very similar. The "mode" number is meaningless it is just a list of the frequencies in increasing wavenumber.
Look at the column headed "Infrared", this identifies the intensity of the various modes, although these numbers are printed to 4 decimal places, they are also only accurate to the integer! Vibrations can only be reliably observed experimentally if their computed intensity is above 10.
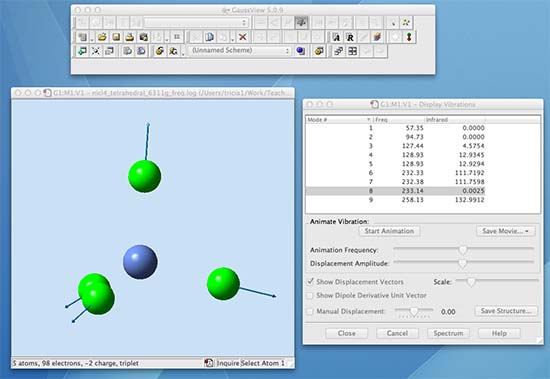
Now carry out a frequency analysis for your B3LYP/6-311G(d,p) level optimised structure. Submit it to run on the SCAN sever. When it has finished open the log file and look at the vibrations:
Once you know your job is OK publish it to Dspace and record the unique DOI for submission as part of the lab.
When you compare the two frequency analysis files, you can see the differences that occur due to a change in the basis-set. Some vibrations occur at slightly different wavenumber ±10 cm-1. When a group of vibrations are very close in wavenumber there can be some "reordering", this is not important as long as you associate the form of the vibration with the wavenumber. For example the totally symmetric vibration (all in-phase Ni-Cl bond stretching) is no.6 in the first file and no.8 in the second file. For the following continue to use the B3LYP/6-311G(d,p) frequency analysis file.
Now examine the vibrations, turn on show displacement vectors, and scale these appropriately. Animate the various vibrations, these are the physical vibrations the molecule undergoes At this point you might want to revise material from my Spectroscopy and Characterisation II course.
Interpreting your data, you can expect to see 3 peaks in the experimental spectrum, at 258cm-1, 232 cm-1, and possibly one at 127 cm-1. If you click on the "spectrum" button a rough representation of the spectrum opens in a new window. A gaussian function has been placed on each active vibration in order to mimic the experimental spectrum.
The second peak will be due to two degenerate (ie same energy) vibrational modes. You will not see 3 of the vibrations because they are not allowed by the symmetry selection rules. Using knowledge you have now, you can rationalize why the all in phase stretching vibration, mode 6 in the list, has zero intensity. For a vibration to be IR active the dipole moment must change. In this vibration the Ni-Cl bonds all stretch symmetrically and the dipole moment remains zero throughout the whole vibration, thus this mode is IR-inactive
In reality most spectrometers only have an operating range from 400-4000cm-1 and you would need highly specialised equipment to observe vibrations lower than 400cm-1. This is why you were given the IR spectra for the complexes you made in the first year synthesis lab.
The experimental spectrum of [NiCl4]2- has been reported:[1] the Raman spectrum has been obtained in solution, and the IR spectrum as a Nujol mull of the solid. These do not occur at exactly the same value and so often more than one number is listed for the wavenumber of a given mode. Experimental vibrational frequencies have been identified; ν1=264 (252) cm-1, ν2=79 cm-1, ν3=(280/294), 289 cm-1 and ν4=119, 112 cm-1. For ν1 the bracketed number has been determined from a combination band because this mode is not IR active. The bracketed values for ν3 are split due to crystal effects and the results from two different experiments are reported. For ν4 the results from two different experiments are presented. Thus, you should also be aware that there can be differences between the data obtained (for the same vibrational mode) from Raman vs IR spectroscopy. There will also be solvent and crystal effects for the solution and solid state spectra, respectively.
[1] Summarised in K. Nakamoto,"Infrared and Raman Spectra of Inorganic and Coordination Compounds" Part A, p194. The original references are: A. Sabatini and L. Sacconi, J. Am. Chem. Soc., 1964, Vol 86 (1), pp 17–20, DOI: 10.1021/ja01055a005 and H.Edwards, L. Woodward, M. Gall and M. Ware, Spectrochimica Acta Part a: Molecular Spectroscopy, 1970, Vol 26 (2), pp287–290. doi:10.1016/0584-8539(70)80072-1
In the Spectroscopy and Characterisation II course you have learned how to derive the correct symmetry for each vibrational mode, weather it is Raman and/or IR active and how to determine the form (displacements) of the nuclei for each vibration in a tetrahedral molecule without carrying out a calculation. In lectures, we also looked at how the program internally computes these modes.
The ν1 mode is the symmetric Ni-Cl stretch, experimentally this occurs about 252-264 cm-1. In the computational study this mode relates to that computed at 233 cm-1. Because the calculations use a harmonic oscillator approximation it is well established that the vibrational frequencies are about 10% "out". This is a systematic error and so we can adjust the computed value to give an estimate of the expected experimental value, this is 233+23.5=255cm-1. Given the relatively low method we have employed our results show a remarkably good prediction when compared with the experimental data.
Thus, the computational study allows us to examine all of the vibrational modes, not just those that are experimentally observable. It also gives us an easy way to access difficult to measure spectral ranges of a molecule. We can also animate the modes and "see" them vibrating. However, we do need to be aware of the limitations of a computational method, vibrational modes require a systematic correction to match experiment, and they can vary with the method and basis set employed. We must also be aware that the experimental values may not be completely accurate due to solvent and crystal packing effects. The best way forward is to gather as much information as possible and make a reasoned analysis employing all of the resources available to us
When you are ready close the vibration window and move onto the next step investigating the electronic structure