
Frequency analysis for BH3
Now we are going to carry out a frequency or vibrational analysis to confirm we have minium structures. This MUST to be carried out on a fully optimised structure. To save time we are also going to set some options for MO analysis. For both the vibrations and MOs to work properly we must have the right symmetry.
Prepare an input file
- The first thing we need to do is to open the file from your 6-31G(d,p) BH3 optimisation and save a copy to edit.
- From the main menu along the top of the screen (in Gaussview) choose "file" and then "open" from the pull-down menu, a new window will open with available files. before selecting a file first check that under "File type" the pull-down menu has "Gaussian Output Files (*.out *.log) selected. Also ensure you have the "Read Intermediate Geometries" tick-box un-checked!! This means gausview opens only the final optimised geometry. Then click on the "open" button
- a new molecule window should open with your optimised molecule in it
- first check the summary, does your optimisation have D3h symmetry?
- If your optimised molecule has D3h symmetry save a "yourname_bh3_freq.gjf" file from this logfile, close the logfile.
- If your optimised molecule does not have D3h symmetry then you need to carry out an additional step to produce a D3h symmetry log file.
- From the main menu along the top of the screen (in gaussview) choose "file" and then "save" from the pull-down menu
- a new window will open, with file names in it, save the file we have just opened file as "yourname_bh3_sym_opt.gjf" in the directory you created at the beginning of the lab. Don't forget the underscore, and make sure there are no spaces in the file name.
- click on the save button
- now we need to impose the symmetry, as you have done this before, the instructions will not be as detailed as previously. Go to the "edit" tab, select "Point Group ..." a new window will appear, tick "enable point group symmetry", choose constrain to subgroup D3h. If D3h does not appear on the menu click symmetrize, D3h will then appear as an option, and you can select it. Now choose very tight for the tolerance and click OK.
- We only constrain the symmetry for highly symmetric molecules and then only in certain situations, it is always best to work in C1 (ie no symmetry) and then impose symmetry later if needed. Thus it is always important to check the symmetry of your molecule
- since we have changed the geometry, we need to re-run the optimisation step, so re-run the job, it should complete very quickly. Open the log file and confirm from the summary that you have D3h symmetry.
- save a "yourname_bh3_freq.gjf" file from this logfile, close the logfile.
- Now everyone should have a D3h *.gjf file from which we can run a frequency calculation.
Edit the file to request a frequency analysis, MOs and charges
- some students have been getting confused, so lets be clear, each job can carry out multiple actions, the actions depend on the keywords you give. In this job we are doing three independent things!
- one is to ask for a frequency calculation
- one is to print the molecular orbitals
- one is to carry out a population analysis to obtain the charges.
- From the main menu along the top of the screen (in gaussview) choose "Calculation" and then choose "Gaussian":
- the calculation palette will appear. It opens with the "job type" tab open, now use the pull down menu under "energy" or "optmisation" to choose frequency (ignore the other stuff that appears)
- then click on the "title" tab to open it, and type "BH3 frequency and MOs"
- then include in the "additional keywords" section "pop=full", this switches on the molecular orbital analysis.
- under the NBO tab select "Full NBO", this carries out the population analysis to determine the charges
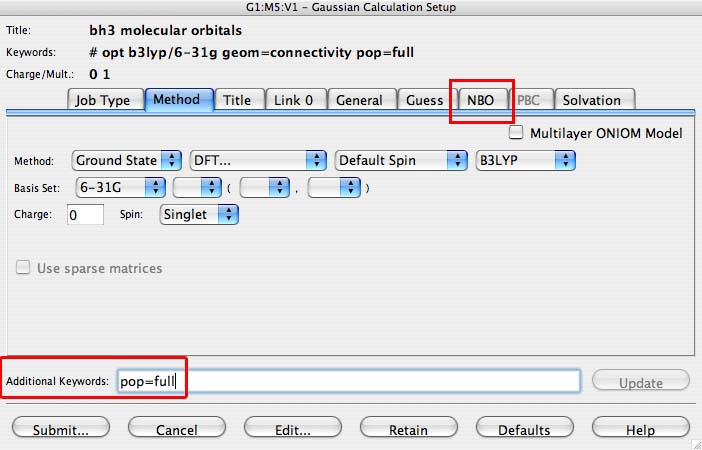
- Then press submit (button is in the bottom left of the palette)
- a new window will pop-up and telling you that you must save the file first, press "save"
- a new window will then pop-up and ask you for a file name, it should already have the filename in the text area: "yourname_bh3_freq", and you should be in the folder you created at the start of the lab, if all this is true then press "save"
- a new window will then pop-up and ask you if you want to overwrite the file, and click yes. Then submit the job, press submit!
- close the molecule window, this is important as the "finished" molecule will look very similar to your starting one and many students accidentally take the wrong molecule!
- Wait for the message "Gaussian Job Completed ...", and click yes for opening a results file.
Investigating the frequency analysis job
- first we need to check that you have carried out the frequency analysis on the right file.
- Open the "Summary" and check that the energy is the same as that recorded for your optimisation (it can vary in the last 2 decimal places but not any higher!), if the energies are different then you have different structures and you need to start this section again.
- If you try this twice and it doesn't work ask a demonstator to help you (you will be doing something incorrectly and they will help you identify what it is).
- Now we are ready to look at the real output for this file
- select the results tab and "view file"
- scroll down until you find the following bit:
Low frequencies ---   -0.9033  -0.7346  -0.0056  6.7352  12.2482  12.2814
Low frequencies --- 1163.0004 1213.1854 1213.1881
Diagonal vibrational polarizability:
       0.7181241       0.7180239       1.8413645
Harmonic frequencies (cm**-1), IR intensities (KM/Mole), Raman scattering
activities (A**4/AMU), depolarization ratios for plane and unpolarized
incident light, reduced masses (AMU), force constants (mDyne/A),
and normal coordinates:
                     1                      2                      3
                    A2"                    E'                     E'
Frequencies --  1163.0004              1213.1854              1213.1881
Red. masses --     1.2531                 1.1072                 1.1072
Frc consts  --     0.9986                 0.9601                 0.9601
IR Inten    --    92.5479                14.0553                14.0589
Atom  AN      X      Y      Z        X      Y      Z        X      Y      Z
    1   5     0.00   0.00   0.16     0.00   0.10   0.00    -0.10   0.00   0.00
    2   1     0.00   0.00  -0.57     0.00   0.08   0.00     0.81   0.00   0.00
    3   1     0.00   0.00  -0.57    -0.39  -0.59   0.00     0.14   0.39   0.00
    4   1     0.00   0.00  -0.57     0.39  -0.59   0.00     0.14  -0.39   0.00
- you know that every molecule has 3N-6 vibrational frequencies, the frequencies listed are these "-6"
- these are just the motions of the center of mass of the molecule
- these frequencies should be much smaller than the first vibration listed, for example the first vibration has A2" symmetry and has a frequency of 1163 cm-1, the largest "zero" frequency is about 12 cm-1 which is an order of magnitude smaller ... so this looks ok.
- The better the method employed the closer to zero these six frequencies should be.
- We normally require these to be within plus/minus 15 cm-1. If your frequencies are not within this range you need to discuss this with a demonstrator.
- Sometimes these can be as large as 50 cm-1 especially for small molecules like the ones we are looking at here. As long as there is a large jump between your "zero" and the first active vibration you should be fine. But, if you have a negative vibration larger than plus/minus 15 cm-1 do get a demonstrator to check there is not something more serious wrong with your calculation.
- If you do not have the correct symmetry labels then your molecule does not have D3h symmtery.
- What you should have is frequencies close to mine, they may not be exactly the same due to slight differences in the optimisation, but they should be the same up to 10 cm-1.
- in the next section we are going to animate at the vibrations themselves and look at the computed "spectrum" generated from the data you are looking at now. The graphical interface will read this part of the file and will animate these frequencies for you.
When you are ready move onto the next step