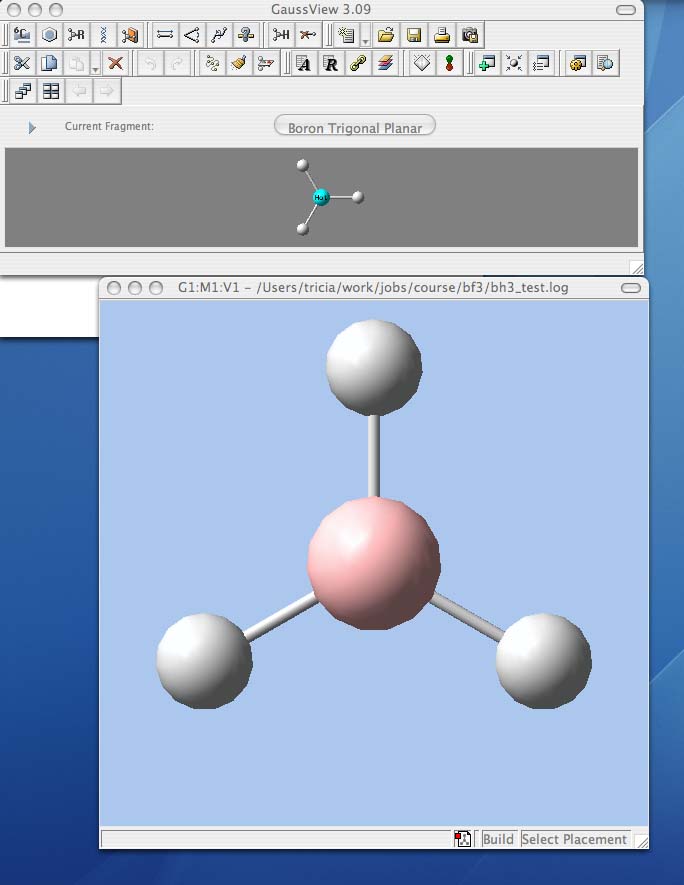
Analysing the optimised BH3 molecule
- you have now compleated your first optimisation!
- open your .log file if it is not already open
- some important conceptual things to know about how the various programs integrate.
- Gaussian "runs" the jobs (ie does all the number crunching)
- Gaussview is a separate program which is used to create and edit files used by Gaussian.
- When you submit a job you or Gaussview makes a .com file and when you look at output you or Gaussview is looking at a .log file
- Gaussian also makes a third file, where it stores information in a "machine only readable format" these are called checkpoint files and have the file extension .chk file
- sometimes we will also use Gaussview to look at .chk files
- Query geometric information from your .log file
- on the comands palette click on the button with a question-mark in front of a ruler. This is the inquiry button and will tell you bond distances if you click on two atoms, and bond angles if you click on three atoms
- use the inquiry button to determine the optimised B-H bond distance and the optimisd H-B-H bond angle
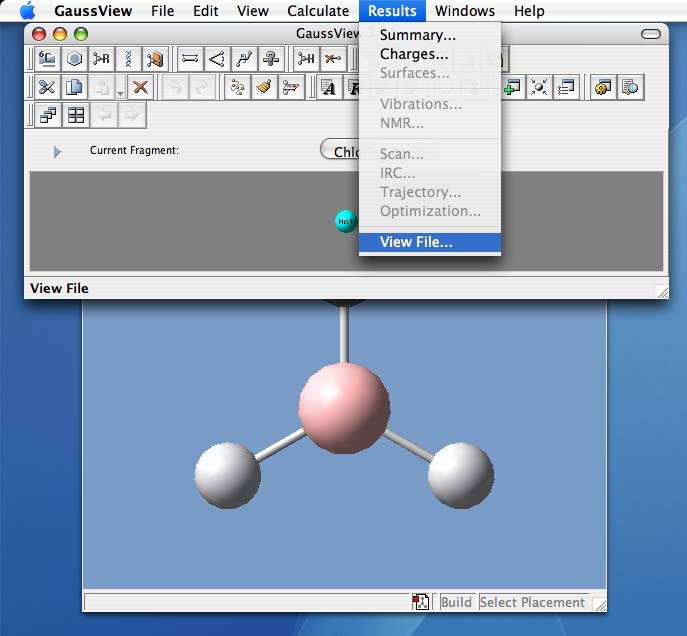
- To find general information about the job
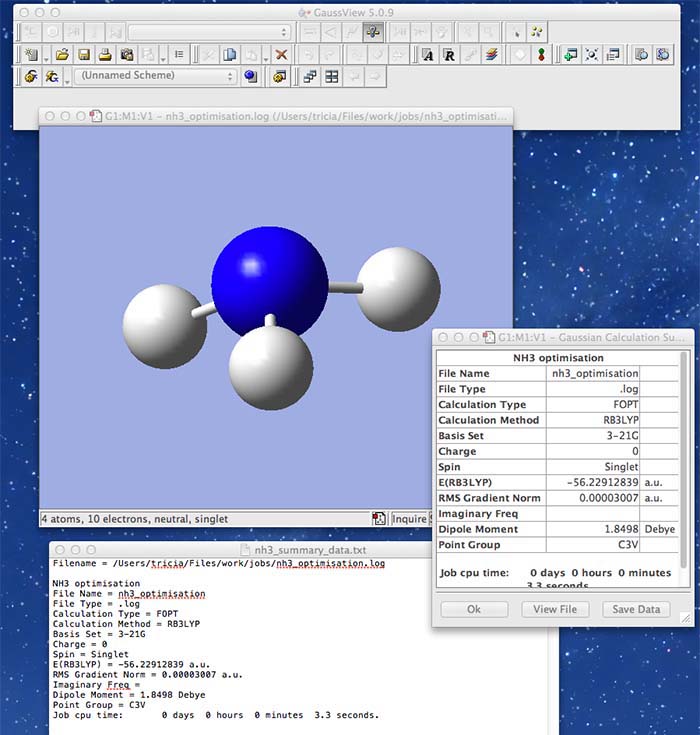
- click on the results tab at the top and choose "Summary". This will open a window that lists important information about your calculation.
- This is the kind of information you always need to be able to report
- What is the file type?
- What is the calculation type?
- What is the calculation method?
- What is the basis set?
- What is the final energy in atomic units (au)?
- What is the gradient?
- What is the dipole moment?
- What is the point group of your molecule?
- How long did your calculation take?
- this informs the reader about the quality of the calculation, it is equivalent to the "experimental details" of a synthesis experiment.
- there is an easy way to capture all of this information, click on the save data button and the data will be saved to a txt file.
- the following image shows the summary information for an ammonia molecule
- You should always explicitly check the symmetry of your molecule
- You might notice that the point group symmetry of your molecule is not what you expect, ie D3h.
- This is beacuse the program requires very accurate numbers to get the symmetry right, and generally they are not accurate enough from just building the molecule on the screen and from a basic optimisation.
- Very small differences in the x,y,z coordinates break the symmetry reducing it. In addition we manually broke some of the symmetry (the C3 rotation symmetry) by setting the bond distances to different lengths. We did not break the mirror plane symmetry (mainly because that is a bit harder to do).
- So you probably have a symmetry that is Cs. At the moment don't worry if you have a symmetry in the "summary" not the same as D3h or Cs.
- You will be shown how to impose the correct symmetry in a couple of steps.
- Your molecule should still have D3h symmetry up to about 3dp in the bond distances and 1dp in the angles! You can check this by using the inquiry button on selecting the bonds and angles.
- The next section on what an optimisation "is" explains some of these other terms in more detail.
- It is very important to check that you have actually optimised the molecule There are a number of checks you can make.
- the first way of doing this is to check the gradient in the summary. The gradient should be close to zero, ie is it less than 0.001? A number larger than this means the optimisation is not complete, and you should ask a demonstrator to help you.
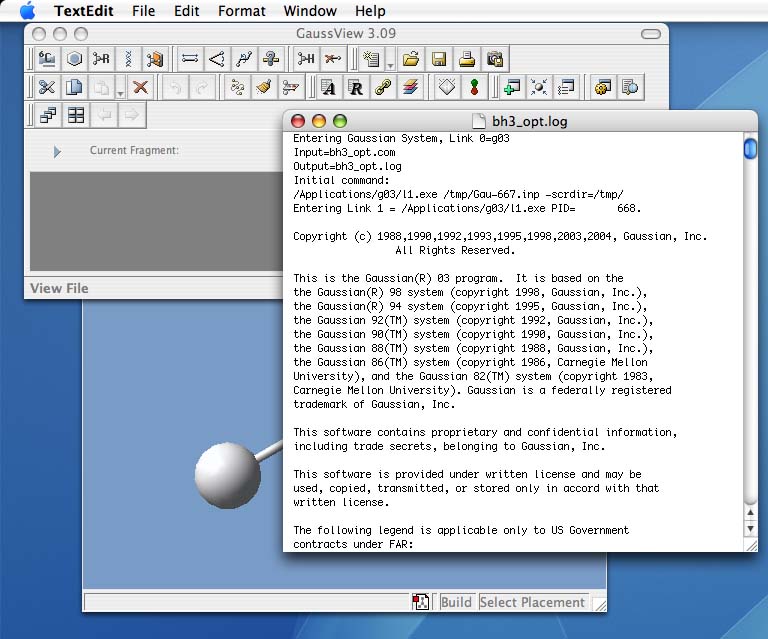
- The second method requires we look in the "real" output
- Gaussview is a graphical interface that takes information from a file and presents it to you graphically. Sometimes we want information that Gaussview cannot process and so we much look at the file output by the program Gaussian.
- click on the results tab at the top and choose "View File ..." A separate window should open, this is the "real" text based .log file. Scroll through the file, if you are interested get a demonstator to tell you about the contents.
- Check that your job has really converged, goto the end of the file and move backwards until you find the final set of forces and displacements, it should look something like this:
Item Value Threshold Converged? Maximum Force .000090 .000450 YES RMS Force .000059 .000300 YES Maximum Displacement .000352 .001800 YES RMS Displacement .000230 .001200 YES Predicted change in Energy=-4.580915E-08 Optimization completed. -- Stationary point found. ---------------------------- ! Optimized Parameters ! ! (Angstroms and Degrees) ! -------------------------- ----------------- ! Name Definition Value Derivative Info. ! ----------------------------------------------------------------------- ! R1 R(1,2) 1.1945 -DE/DX = -0.0001 ! ! R2 R(1,3) 1.1945 -DE/DX = -0.0001 ! ! R3 R(1,4) 1.1945 -DE/DX = -0.0001 ! ! A1 A(2,1,3) 120.0 -DE/DX = 0.0 ! ! A2 A(2,1,4) 120.0 -DE/DX = 0.0 ! ! A3 A(3,1,4) 120.0 -DE/DX = 0.0 ! ! A4 L(2,1,4,3,-2) 180.0 -DE/DX = 0.0 ! ------------------------------------------------------------------------ GradGradGradGradGradGradGradGradGradGradGradGradGradGradGradGradGradGrad - the important information is in the part below "Item" this tells us that the forces are converged (remember force is the gradient or slope of the energy vs distance graph. It also tells us that the placements are converged, this means that for a small displacement the energy does not change (within a certain amount).
- You should always check the "Item" section of your output at the end of an optimisation, even if gaussview "thinks" the job has finished properly. Gaussview is only a program it is not as good as a human, there are cases where the job will have been terminated for other reasons than complete optimisation and it is important to check that this has not happened.
- All of my students keep a "log book" of their calculations and are required to add a copy and paste of the "Item" table of converged forces and distances in it. You will do something similar when you update your wiki page.
- When you are ready move onto the next step