
Ammonia
The Inversion Mechanism
remember, we have actually optimised the ground state for NH3 under C3v symmetry and the planar inversion transition state which has D3h symmetry.
But how can we connect these structures together on a "reaction path"? Typically we compute something called a "scan", we vary one coordinate while allowing all others to optimise. In this case the reaction coordinate is the movement of the hydrogen atoms in an umbrella motion.

Since you are using Gaussview (a graphical interface to Gaussian) you will not be able to carry out the next calculation, and so I have done it for you. Gaussview is primarily for non-technical applications, and it cannot generate input files required for some of the more sophisticated options available in Gaussian, one of which we are going to use now.
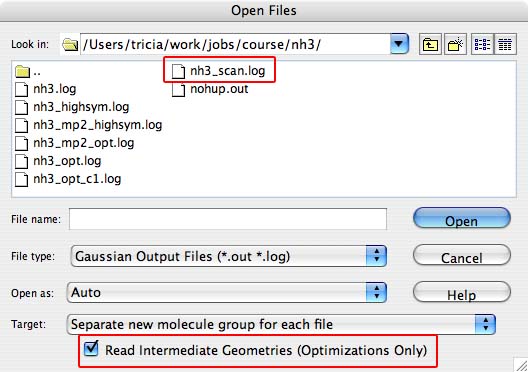
- Save the nh3_scan_log.txt file to your local directory with all your jobs in it.
- Change the extension form .txt to .log and open the file in Gaussview. When you open the file be sure to click on the read intermediate geometries tick box.
- first lets look inside the text of the file, goto the Results tab and choose "View File", scroll though the file. You will notice that it looks very like a sequence of iterations ... this is exactly what is happening, we are stepping over the potential energy surface in a very controlled way
- near the end there is a section in the output file that looks like the following:
Summary of Optimized Potential Surface Scan 1 2 3 4 5 EIGENVALUES -- -56.56750 -56.56765 -56.56806 -56.56874 -56.56962 R1 .99867 .99867 .99929 1.00002 1.00102 A1 90.00000 88.00000 86.00000 84.00000 82.00000 T1 120.00000 120.00000 120.00000 120.00000 120.00000 6 7 8 9 10 EIGENVALUES -- -56.57067 -56.57182 -56.57300 -56.57410 -56.57505 R1 1.00232 1.00388 1.00570 1.00776 1.01005 A1 80.00000 78.00000 76.00000 74.00000 72.00000 T1 120.00000 120.00000 120.00000 120.00000 120.00000 11 12 13 14 15 EIGENVALUES -- -56.57572 -56.57603 -56.57585 -56.57509 -56.57365 R1 1.01254 1.01525 1.01814 1.02124 1.02454 A1 70.00000 68.00000 66.00000 64.00000 62.00000 T1 120.00000 120.00000 120.00000 120.00000 120.00000 16 17 18 19 20 EIGENVALUES -- -56.57142 -56.56833 -56.56431 -56.55930 -56.55321 R1 1.02805 1.03178 1.03574 1.03995 1.04447 A1 60.00000 58.00000 56.00000 54.00000 52.00000 T1 120.00000 120.00000 120.00000 120.00000 120.00000 - the energies are the important part for plotting the potential energy surface (PES), and the values under A1 are those that change over the "scan", they relate to the angle from the H-N-C3 axis, each scan step has a different A1 angle.
- close this window now and return to the main molecule window, oreintate the molecule so that you are looking side-on to the molecule.
- now click on the green button on the top left, this will run a "movie" of the scan process. You should now see the H atoms moving down from the plane of the N atom, and then the "movie" will reset, click on the green button again to stop the animation. You can also step through the animation by clicking on the up and down arrows.
- Goto the Results tab and choose "Scan...", a window should appear with energy on one scale and scan step number along the x-axis. This is a plot of the energies (eigenvalues shown above). Click on the green "movie" button again and watch the red circle move over the PES as each new geometry is visited, if it is too fast use the arrows and step over the PES.
- if you are interested in how this is done, then you can try copying (to nh3_scan.com) and then running the following file nh3_scan_com.txt. It is important that this file is NOT opened in gaussview, gaussview will overwrite key information.
- Change the extension form .txt to .log and open the file in Gaussview. When you open the file be sure to click on the read intermediate geometries tick box.
The following papers offer more insight into the inversion process
- doi "Trends in Inversion Barriers of Group 15 Compounds. II. Ab-initio and Density Functional Calculations on Group 15 Fluorides." P. Schwerdtfeger, P.D.W. Boyd, T. Fischer, P.A. Hunt, and M. Liddell. J. Amer. Chem. Soc. , 1994, 116, 9620.
- link "Trends in Inversion Barriers of Group 15 Compounds. I. Group 15 Hydrides.", P. Schwerdtfeger, L.J. Laakkonen and P. Pyykko. J. Chem. Phys. , 1992, 6, 6807.
In this section you have seen the correlation between energy, structure and motion over the PES. You have also been introduced to the concept of a "scan" which is how we follow a chemical reaction over time, which is just the same as following a path over the potential energy suface.